Behind the scenes of “Dutch Designer: What do you do?”
For my article on Dutch Designers I analysed a questionnaire with 83 participants. This is the place where I share the details of the analysis with you.
Off into the Mariana Trench of DATA! #
Getting these statistics was not easy, it took me some magic tricks in Wizard, Numbers, Orange and plain-old-terminal commands 🤓
Now put on your diving gear, we’re going deeeeep into the data!
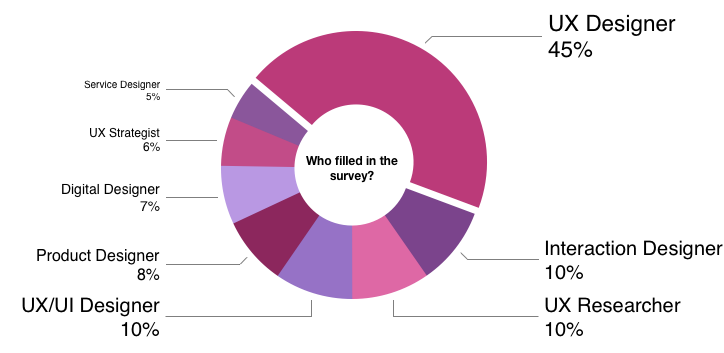
Who filled in my questionnaire? #
In statistician terms, n=83 with an unequal distribution of groups. 45% of all participants were UX designers (that’s nearly half!)
Of the 83 people that filled it in, 32 had 10 years of experience (or more). The average is almost 7 years of experience (note that ‘average’ is not really accurate, because one of the answer-possibilities was “10+”).
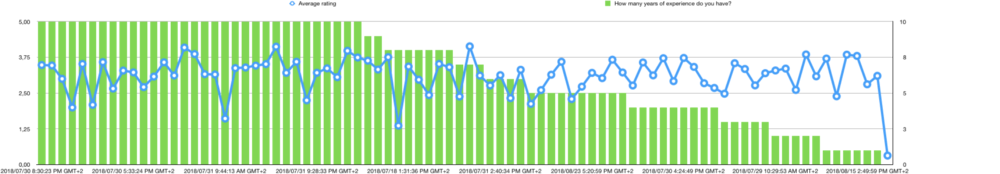
Strangely, there seems not to be a correlation between work-experience and skill-rating. I expected to see a bit of Dunning/Kruger effect here.
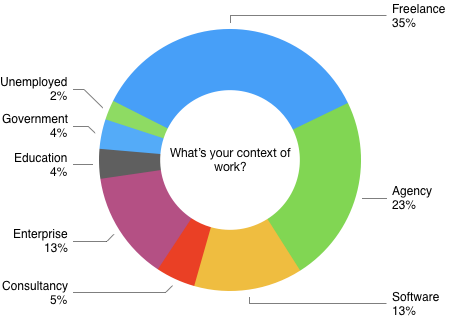
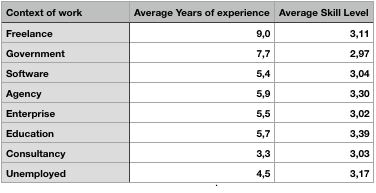
Context of work #
I asked people how they worked (freelance, agency, etc.), but didn’t use this “context of work” in my original article as the results were not as interesting as I expected. Nevertheless, here’s a cool graph:
Analysis of tasks #
The most interesting part of the survey is the self-rated skill-level (“how proficient are you at …”). Here I had an interesting challenge: I gave people the option of 1, 2, 3, 4 or 5 stars — and a ‘not applicable’. I struggled with this last category a bit: how do I make a nice average out of this ‘not applicable’? I decided in the end to treat it as ‘missing data’, instead of assigning a -1 or 0. This means you calculate an average with only the values actually given. The downsize is that individuals can have a big impact in groups with only a few participants. Example: if everybody assigned ‘not relevant’ to a skill and one person gave it 5 stars, the whole group gets ‘5 stars’ at that skill…
I later used the ‘not applicable’ as a way to measure the relevance of a particular skill . The skills people indicated mostly as ‘not applicable’ are photography, creating the sales proposition, print design (business cards, envelopes, etc.) and writing code (for instance JavaScript).
Here you see all skills based on the relevance: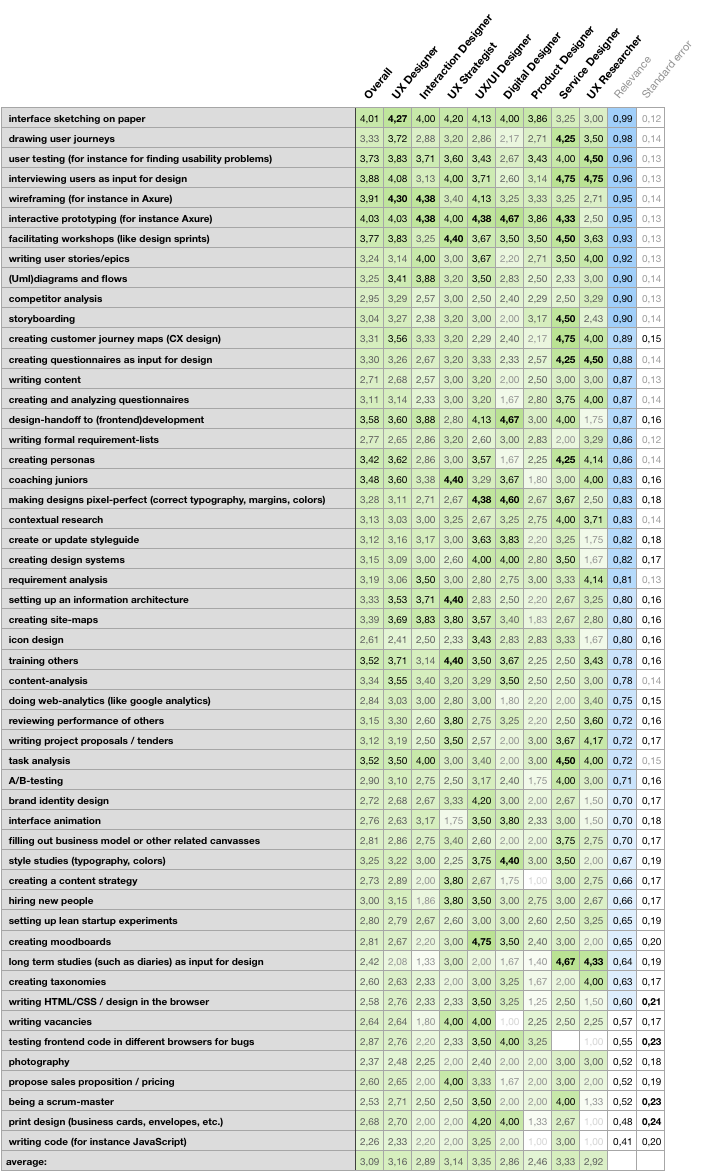
I can not stress how happy I was to see this graph (table?). It indicates something useful and expected. Just when I thought nothing came out of my study after hours of digging in the data!
The nitpickers among you* will notice the ‘averages’ in this table are not the same as the ones I used in my original article. The average you see above is an average over ‘the average of the skill-levels per group’ which is different from an average over ‘the average of all individual answers per group’. A formulaic-expression and indepth insights in why these are different are available upon request.
*if you noticed this difference, I applaud you for reading my articles so thoroughly and invite you over for a beer where we can discuss the use of commas and the difference between a ‘mean’ and an ‘average’
Visual inspection is deceptive #
By looking at the graph it seemed there was a lot of overlap between Service Designers and UX Researchers. Both scored very high on interviewing users, making and analyzing questionnaires, task-analysis, creating personas, user testing and drawing journey maps. This is a deception!
By using a Statistical Analysis™️ in my similarity-matrix (below), I figured out there is not a big overlap between these two. The deception is most likely because the columns are close together and because ‘we humans’ like to see patterns in data.
Variance #
There is a lot of variance in my data, which is probably due to the small sample-size. But it is interesting to see that there are some skills that you are consistently either very good at, or very bad at: print design, being a scrum-master, testing frontend code in different browsers for bugs and writing HTML/CSS / design in the browser.
You could use this high variance to see which skills you can develop to set you apart from the average designer. Especially skills high in the relevance rating are interesting, of course: creating customer journey maps, handoff to developers and creating pixel-perfect designs.
The Similarity Matrix #
I wanted to know how much groups were ‘similar’ to eachother. What you see below is a matrix with the average difference in answers (the mean variance). I based this on the top 34 skills (those with a relevance above 0,70). That cut-off point is a bit arbitrary, but is to accommodate for the impact of non-relevant skills.
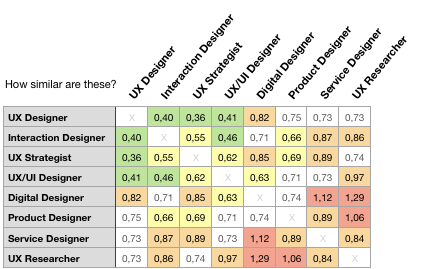
How to use this matrix? #
Take row and a column and see how ‘similar’ certain groups are. A low-number means a high-similarity. I’ve colour-coded the results to indicate interesting findings. Who knew UX Researchers are so different from Digital Designers and Product Designers!
Machine Learning #
As I have a degree in Artificial Intelligence, I thought it would be a Great Idea to see if a computer could make more sense of this data than I could. The 83 data-instances I have are not a good base for machine learning (you need loads more), but that didn’t stop me from trying 🤓
I tried a Neural Network and k-Nearest-Neighbour modeling technique and as expected, they couldn’t create a decent classifier for my data. Both had a very low recognition-score, even when using the test-data as validation-set (which you should obviously never do, normally).
It seems my kNN found a couple of ‘undercover interaction designers’: most of the classification errors came from UX Designers that were seen as Interaction Designers. And the Neural Network got even more confused: it mixes up UX Designers, Product Designers, UX Strategists and UX/UI Designers. It does confirm that these four are kind-of similar!
k-Means #
I also checked out what would happen if I’d let the computer come up with good groups by doing a k-Means analysis (a technique that tries to find clusters in a pool of data). As expected, it didn’t find the exact 8 groups I defined. Instead it seems more logical to go for 2 groups (or 3).
It’s interesting to see that these two groups do make sense. Group 1 (the smaller group with 27 people) is very visually oriented, Group 2 isn’t (56 people). The top-15 tasks that make the biggest difference between the two groups are: making designs pixel-perfect, style studies (typography, colors), create or update styleguide, writing HTML/CSS / design in the browser, print design (business cards, envelopes, etc,), creating moodboards, creating design systems, icon design, being a scrum-master, design-handoff to (frontend)development, brand identity design, testing frontend code in different browsers for bugs, interface animation, writing code (for instance JavaScript).
So according to the algorithm it makes sense to talk about 2 types of designers: a visual designer and a non-visual designer.
Conclusions #
If you want to read my conclusions on what Dutch Designers do, just read my original article!